New Features for Safety Voyager Version 2
Posted on February 9th, 2018
Welcome to Safety Voyager Version 2!
Crash data for 2017 has been included in Voyager along with new modules to explore the all of the data. Click on each for more details:
- Crash Map: interactively select and filter crash data.
- Trends: view crash data safety trends and statistics by jurisdiction.
- Emphasis Areas: view crash data aggregated and juxtaposed by areas of interest.
- Safety Calendar: view crash data aggregated by the NHTSA Safety calendar themes.
- Reports: generate a crash attribute report that compares a jurisdiction against the statewide crash data.
- Updates Blog: see the latest news and updates about Safety Voyager.
Crash Map
Crash Map allows users to display crash data on a map using various filters. There are over 10 filter categories to choose from including Crash Magnitude and Driver's Physical Status. The map will update, showing all crashes that fall under the filteres chosen.
Crashes are grouped as circular nodes that represent the crashes within certain areas of the map. The nodes are color coded relative to the number of crashes within the area. Green nodes indicate small number of crashes while red nodes indicate large number of crashes.
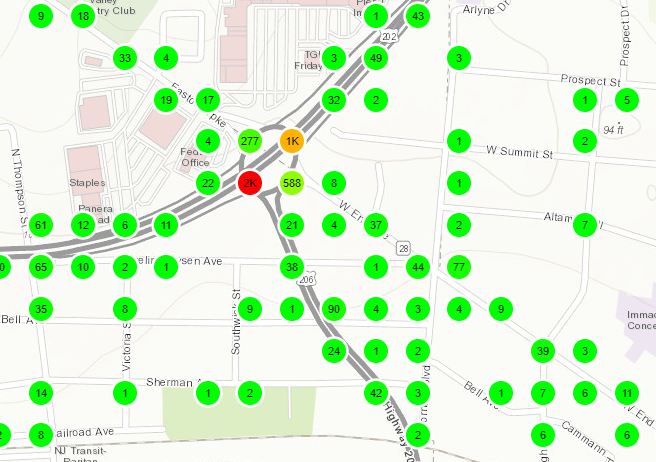 Green, Yellow, and Red Crash Nodes
These nodes can be clicked which display a table of all the crash cases that are contained with this node as well as pie charts which breakdown the crashes into different crash types. Each crash case can be viewed for more detail which includes information about the driver, vehicle occupants, and pedestrians.
Crashes can also be viewed as a 3D bar graph on the map if searched by route, address, or place. The entire graph is overlayed on top of the route. The bars represent the number of crashes at every milepost with green being a lower number of crashes and red being a higher number of crashes relative to the route. Filters can be applied to the data and the bars can be clicked to show a table of all crashes that pertain to the individual milepost.
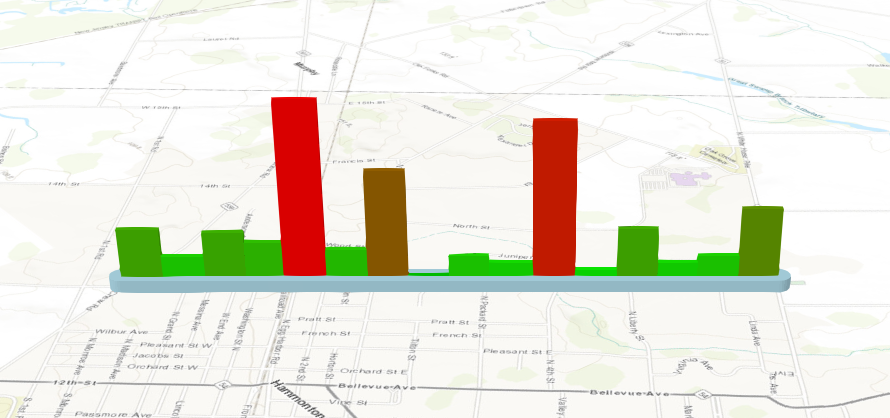 3D Crash Graph of Atlantic County
Trends
Trends allows users to graphically display crash data and trends from 2002 to 2017 for all jurisdiction levels. From specifying the jurisdiction level, crash type, year range, and time range, Safety Voyager will display the graphs of crash counts for the following categories:
- Occupant Fatalities
- Occupant Injuries
- Pedestrian Fatalities
- Pedestrian Injuries
- Cellphone Use
- Crashes at an Intersection
For each category, Safety Voyager will display graphs and statistics such as the number of crashes in each year, the average number of crashes for the year, and the overall percent change of crashes for the year range.
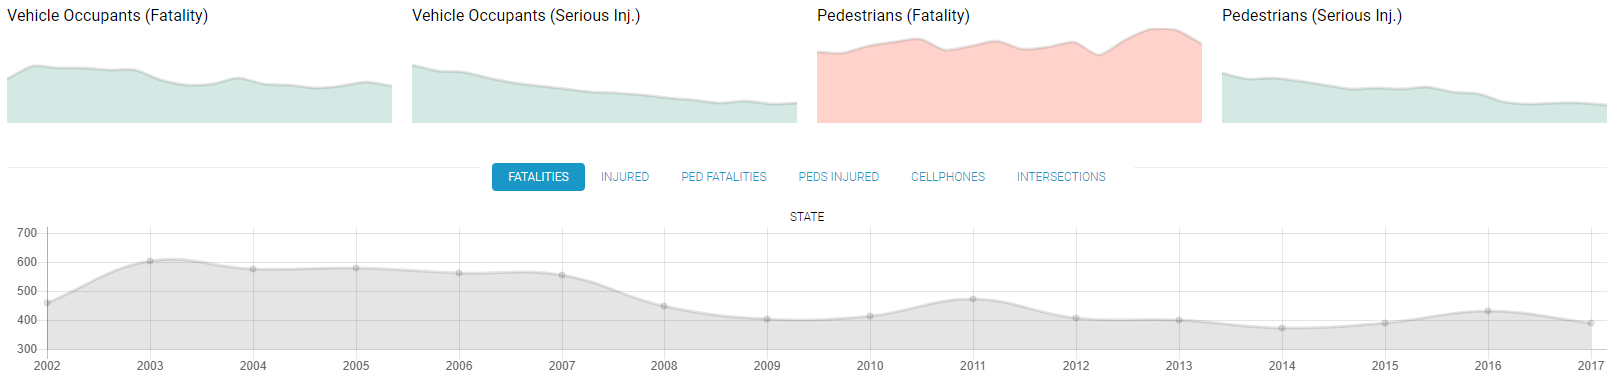 Several Safety Trend graphs for Atlantic County
Emphasis Areas
Emphasis Areas allows users to determine spatial trends for MPO, County, or Municipality from aggregated and juxtaposed data.
After specifying the jurisdiction level and year range, Safety Voyager will display graphs of the raw counts or rolling averages for several crash types including Lane Departures, Younger Drivers, Heavy Vehicles, and Aggressive Driving. These interactive graphs can be hovered to show the year and counts, and can be enlarged for a more detailed view.
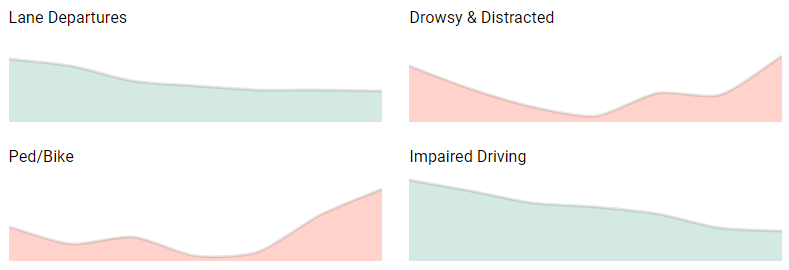 Several Emphasis Area graphs displaying the raw count of Fatalities for New Jersey State
Safety Calendar
Safety Calendar is a new extension of Safety Voyager's Crash Map which incorporates NHTSA Safety Calendar. Users can choose from various safety themes such as Aggressive Driving and specify the county or municipality to display crash data and school data.
Clicking on any crash point or school point on the map will display details about the point such as district name and address.
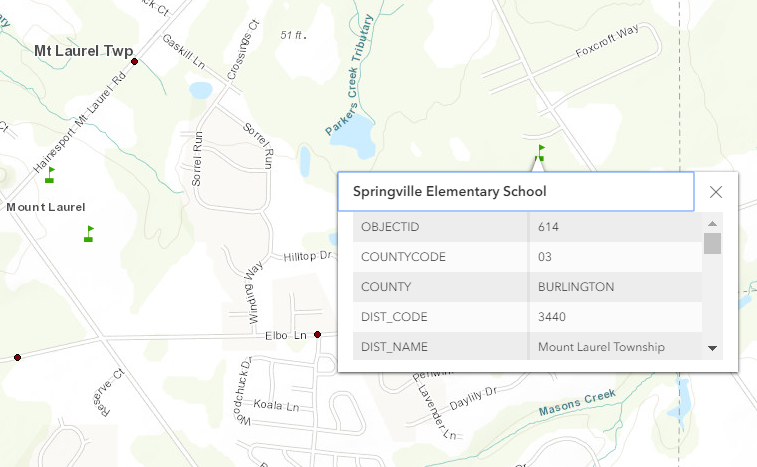 School data for Burlington County from the Safety Calendar
Reports
Reports generates reports for user selected jurisdictions. These reports display municipality data across different crash categories and breaks down the categories into crash characteristics.
The report shows the raw crash counts and percent total of all crashes in the characteristic in both municipality and state-wide level. Rows are automatically highlighted if the municipality percent exceeds a threshold over the state percent.
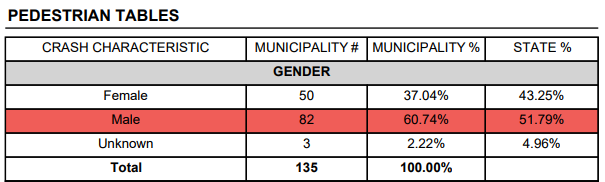 Part of a Jurisdiction Report for Absecon City in Atlantic County
Updates Blog
Updates Blog is the new blog where all updates and additional features in Safety Voyager will be announced.