New Features for Safety Voyager Version 3
Posted on November 1st, 2018
Welcome to Safety Voyager Version 3!
There are many exciting enhancements that have been added to Safety Voyager! As you start to use the upgraded application, these are some of the things you might notice:
- Crash Reports: view the NJTR1 redacted crash reports.
- Crash Cluster Selection Tool: select crashes interactively using a polygon drawing tool.
- Data Improvements: incorporation of all Accident Records Database data as well as database updates.
- Improved Clustering Algorithm: streamlined and improved data visualization while navigating the map.
- System Updates: updates to backend data organization, loading, and access for the new version.
Crash Reports
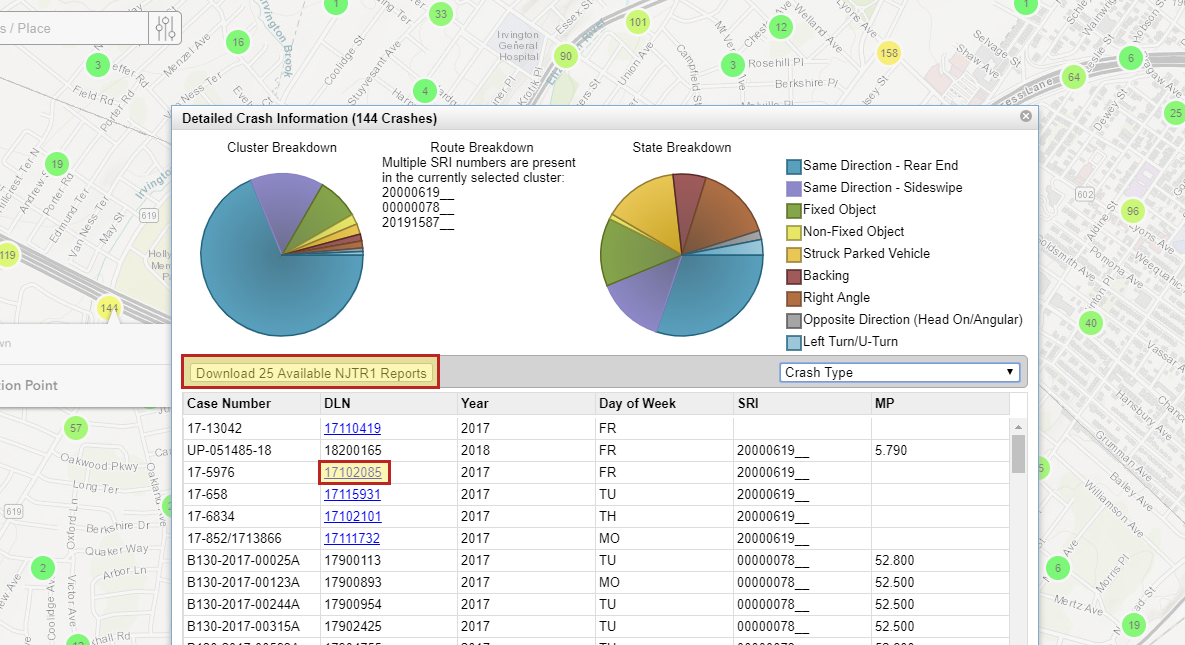
The most requested feature update is the ability for users to access the NJTR1 crash reports directly from the Crash Map application. These reports have been redacted to protect personal information. Currently, there are over 200,000 NJTR1 reports linked to the accident data, mostly from recent crash events (years 2017 and 2018). We will continue to load more reports and will provide updates via this blog.
Available redacted reports show up as a link in the Detailed Crash Information window where available. These reports can be downloaded as a PDF with just one click. See the highlighted boxes in the image below.
Crash Cluster Selection Tool
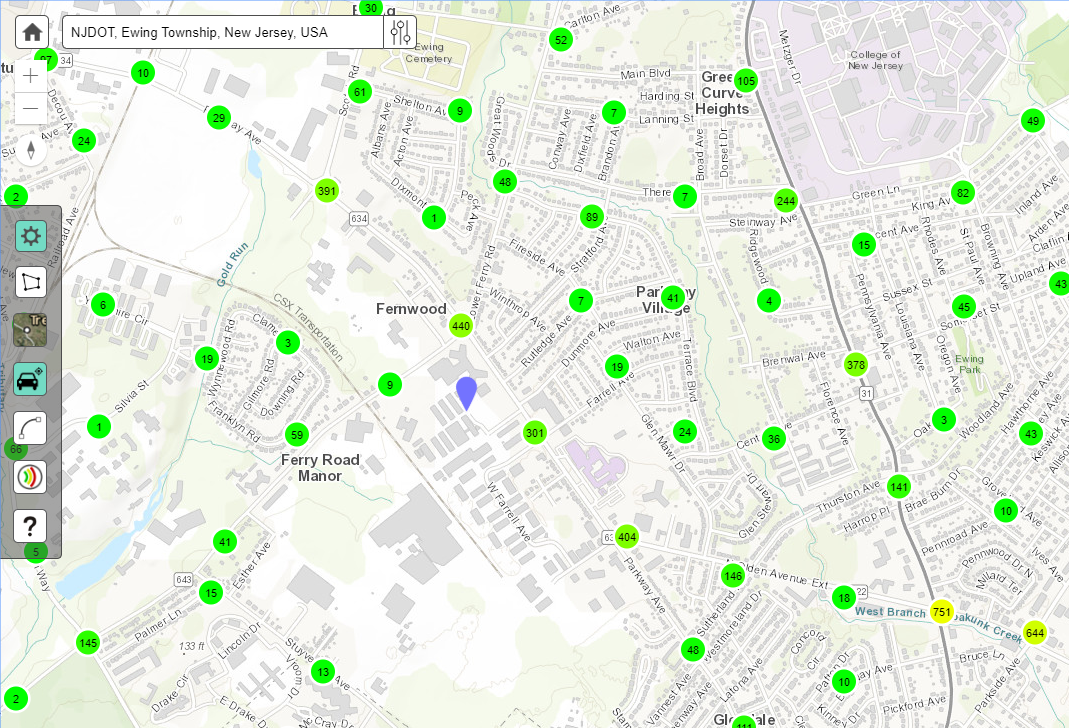
Users also requested the ability to select crashes by drawing a polygon on the map. We answered that by creating the Crash Cluster Selection Tool which can be found on the Advanced Map Visualizations Menu. This tool isolates the selected crashes in the Detailed Crash Information window and highlights the crashes on the map that are linked to a NJTR1 report.

Data Improvements
Safety Voyager now uses the Accident Records Database (ARD) to obtain all relevant crash related data. This allows the user to access all non-personal crash data populated on the NJTR1 forms. While transitioning to this data source, improvements have been made to the data processing which will allow the application to update crash data bi-weekly ensuring that users have access to the most current ARD available. As such, crash data from 2017 has been loaded into Safety Voyager and 2018 data is being loaded as it becomes available.
Improved Clustering Algorithm
We have updated the crash cluster algorithm to improve the visual results of the crash data at all zoom levels. The number of crashes displayed on the map will be identical to before but the user will see an improvement in both the positioning (in general) and density of clusters, improving the legibility of the map from a data perspective. Clusters will better align to the roadway network and provide more contextually sensitive grouping of data.
System Updates
The mapping engine for the Crash Map has also been significantly updated for a faster response time for data visualization. This was accomplished by updating our tools to give the user the best experience, creating data loaders to take the data from the Accident Records Database to the geospatially enabled final product, and developing new data indexes to streamline the client server interaction.