Pedestrian and Bicycle Safety Module
Posted on June 28th, 2019
The Safety Voyager Team is proud to announce the Pedestrian and Bicyclist Safety Modules. These new modules focus on pedestrians and bicyclists. As automobile manufacturers continue to improve crash safety features, there has been a national trend towards reduced vehicle occupant fatalities.
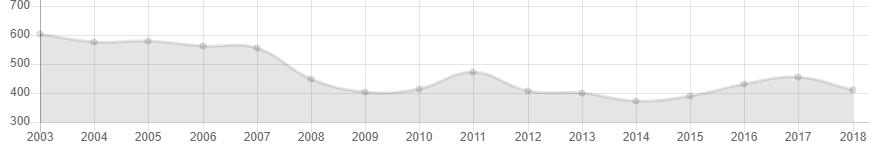 NJ fatal crashes have been trending downward since 2003.
As vehicle occupant fatalities have decreased, bicyclist and pedestrians have been experiencing an inverse trend, as shown below with data from the Safety Trends module.
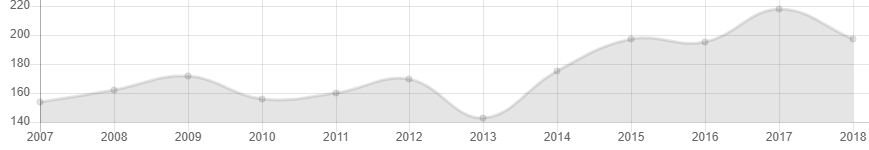 NJ fatal pedestrian and bicyclist crashes have been trending upward since 2007. (current capture shows 2007)
The FHWA, NJDOT, and the Safety Voyager Team created the Pedestrian Dashboard and Pedestrian Heatmap Modules to provide the user with a visual representation of the data needed for various engineering and planning analyses. Additionally, tutorials have been created to assist users with these tools, and they are located in the Updates Blog.
Pedestrian Dashboard
The Pedestrian Dashboard module provides the capability to analyze at all jurisdiction levels in conjunction with the ability to look at specific routes for further granularity. It also provides the users the ability to output tabular data for all areas of interest as well as copy the charts* for use in reports and presentations.
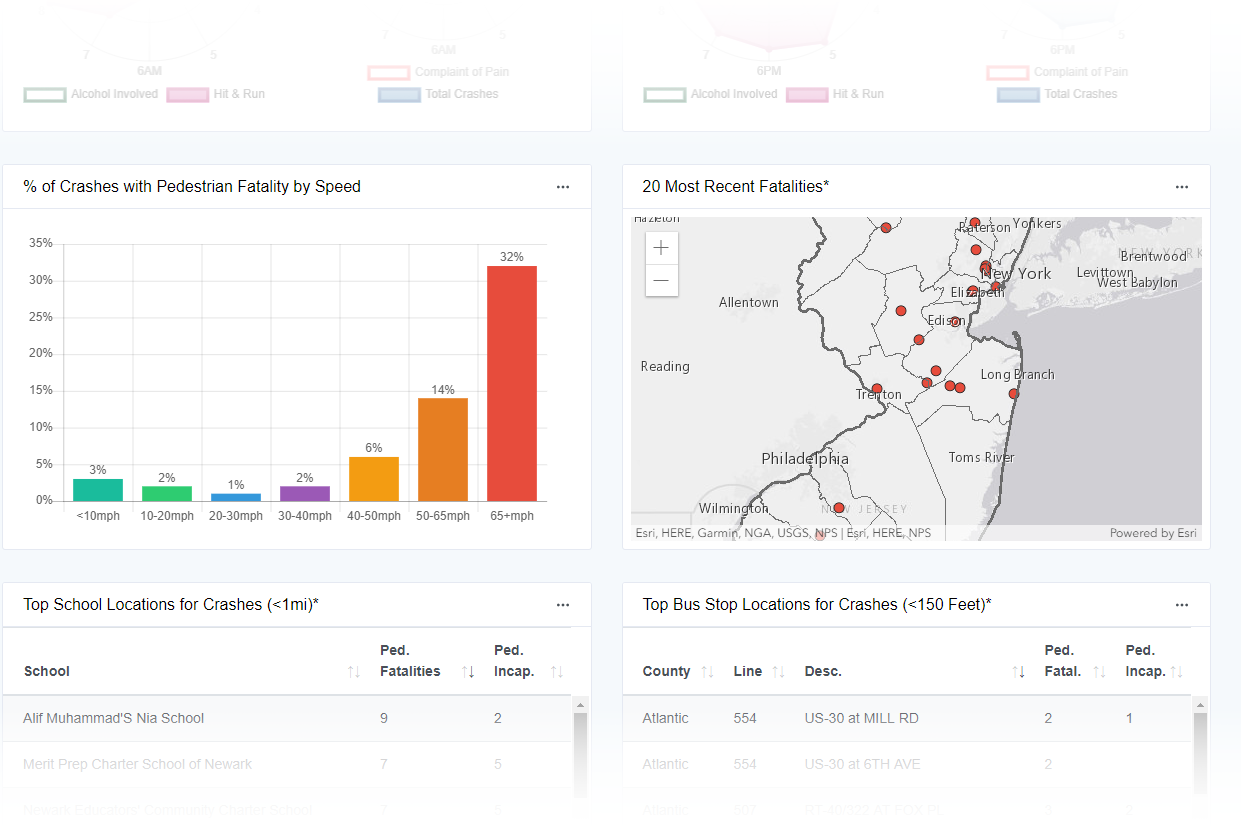 Dashboard visualization of pedestrian and bicyclist data showing trends and areas of interest.
Pedestrian Heatmap
The Pedestrian Heatmap allows the user to quickly visualize pedestrian and bicyclist crash trends via a dynamic heat map. In addition to being able to search by jurisdictions, routes, schools, and bus stops, the user can also filter the crash data. Filters include a date range, ped types, severity, crash attributes, alcohol involvement, time of day, school-related attributes, and several others.
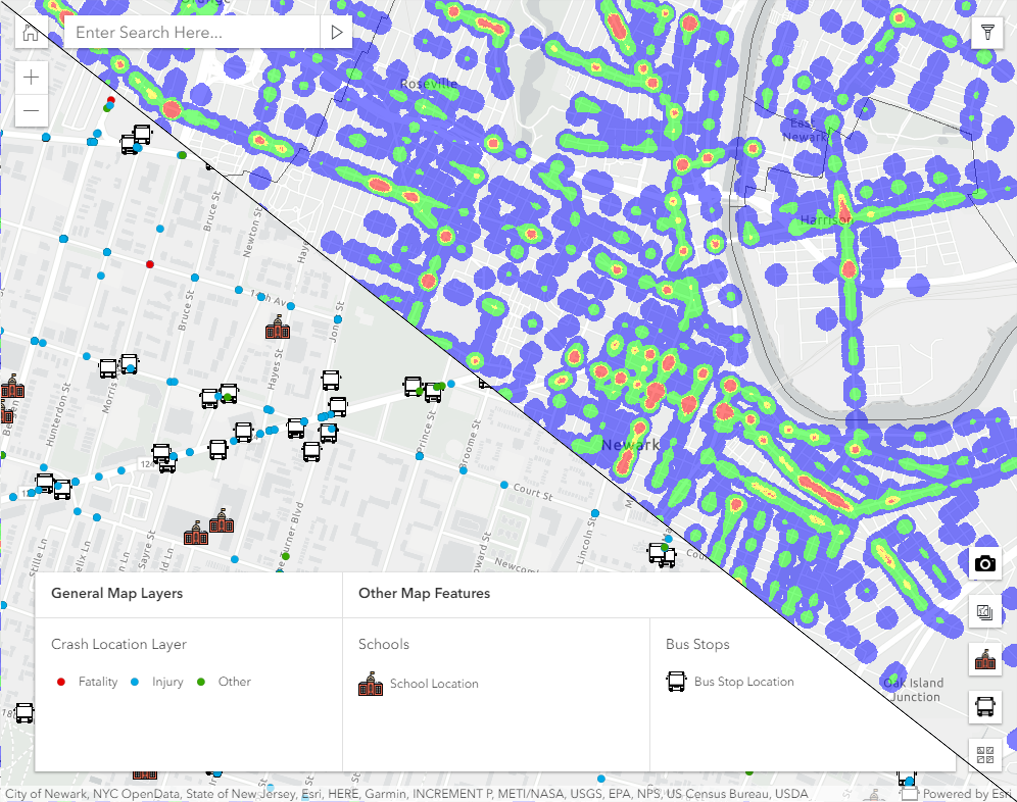 The Heatmap Module provides a picture of the areas with high concentrations of pedestrian and bicyclist crashes.
* The user can directly copy and paste the graphs using Google Chrome, the screenshot tool in FireFox or use the Snipping Tool in Windows Edge.