New Features for Safety Voyager Version 4
Posted on July 13th, 2020
Welcome to Safety Voyager Version 4!
Safety Voyager Version 4 introduces exciting additions to the Crash Map module! As you start to use the upgraded application, these are the new live features:
- Query Menu: save user queries and map views.
- Quick Filter Menu: a new, alternate filter menu provides a quick and streamlined approach to filtering crash data.
- SRI Labels: shows milepost and crash count on Standard Route Identifiers (SRI) graphs.
- New Results Grid Tools: users can now save an image of the current map view and export a CSV file of the Results Grid.
- Feedback Form: provide feedback on bugs, suggest feature ideas, or inquire about the crash data.
Query Menu
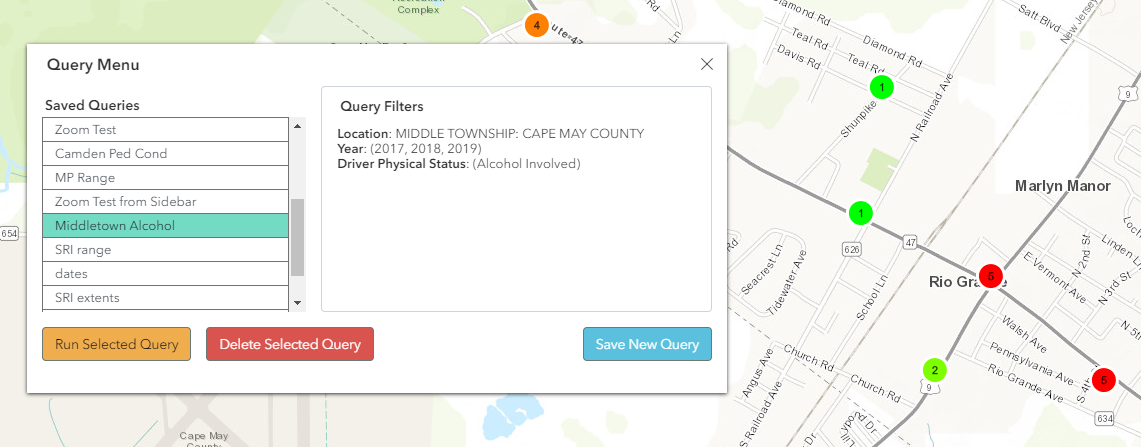
One of the most requested features is now live in the Crash Map module - the ability to save and re-run custom queries! The Query Menu, found under the Advanced Map Visualization Options, allows users to save, run, and delete custom queries, including any applied filters and the map view.
Quick Filter Menu
A new and alternative to the filter menu, the Quick Filter Menu allows users to query crash data through a streamlined workflow using popular filters, including Persons Severity Rating, Location, and SRI. Crash data can also be filtered by date range and Crash Attributes such as Alcohol Involved and Hit and Run.
The Quick Filter menu is for users who are new to the Crash Map module or for users who would like to quickly query crash data with filters.
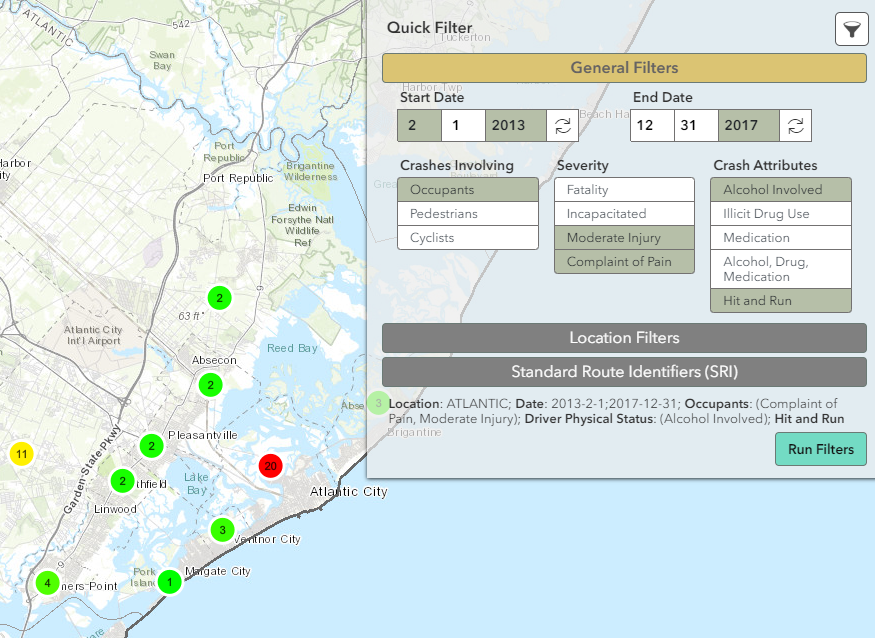 The Quick Filter menu shown with several filters selected for Atlantic County. The selected filters are shown on the bottom of the menu.
SRI Labels
SRI graphs now show labels above each crash bar which identifies the milepost and crash count. Labels can be toggled on or off by selecting the SRI tool under in the Advanced Map Visualizations Options.
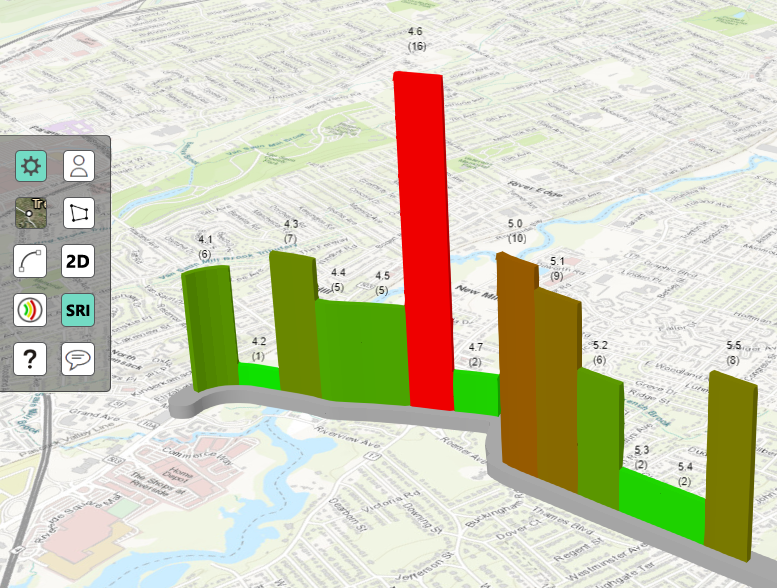 SRI labels showing milepost and crash count for each bar.
New Results Grid Tools
The Results Grid now has two new tools: Map Screenshot and Export Results Grid. The Map Screenshot tool allows users to download the current map view - clusters or SRI - as an image format. If using any image from Safety Voyager, please either keep the copyrighted text in the image or cite Safety Voyager in your sources.
Data in the Results Grid can now be exported as a CSV file, including column headers and grid data.
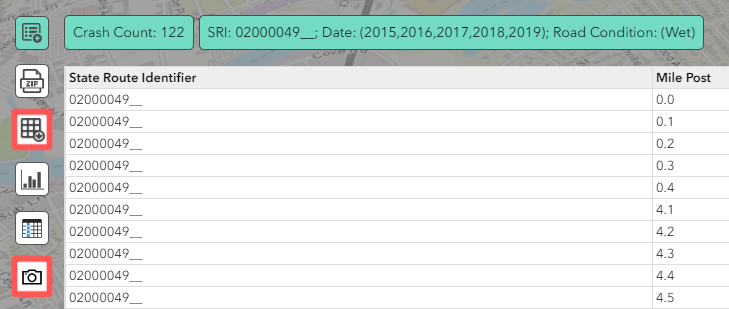 Export Results Grid (top) allows users to download grid data as a CSV file and the Map Screenshot (bottom) to save an image of the map view.
Feedback Form
The Feedback Form allows users to submit bugs found on the Crash Map, suggest new features to implement, report crashes in wrong locations, or inquire about the crash data. The form is under the Advanced Map Visualizations Options or any popup from clicking on a crash, SRI crash bar, or in the Detailed Crash Information pane.
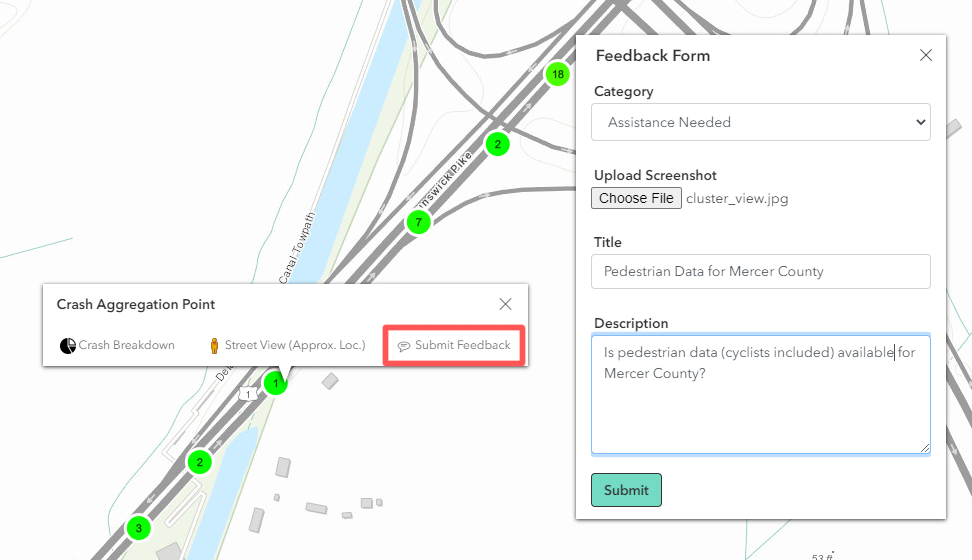 The Feedback Form can be opened in all popups and from the Advanced Map Visualizations Menu.